🐰Introduction
Data Viewer allows you to more intuitively view the attributes of geometry in the 3D view without having to switch to the spreadsheet editor. This can be useful for debugging and troubleshooting, as well as for understanding the structure and relationships of 3D models.
For example, you can preview the ID or index value of a vertex, edge, or face directly in the 3D view, which can make debugging easier. You can also view other attributes, such as position, rotation, and radius, depending on your input.
Data Viewer provides many custom parameters, such as field type, number color and size, flat or vertical orientation, decimal places, alignment, axial arrows, and optimization for large amounts of data.
I offer three versions of Data Viewer: Lite, Standard, and Professional. Please check out comparison table section
🐧Installation
You can get the latest version from Blender Market or Gumroad.
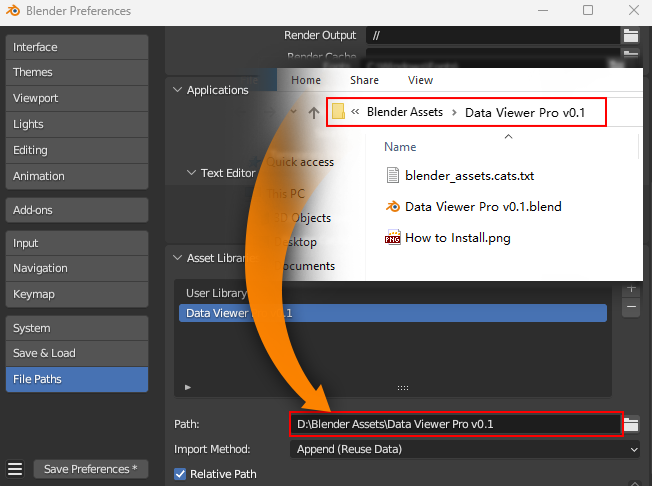
Since the Data viewer is a node group, you can put it in the asset path. After downloading, extract it to the path you want, usually you would store it with your other assets.
Open Edit - Preference - File Paths, add the path to Asset Libraries, and save it (automatically saved by default).
Data viewer requires blender version at least 4.0.
🦄How to use
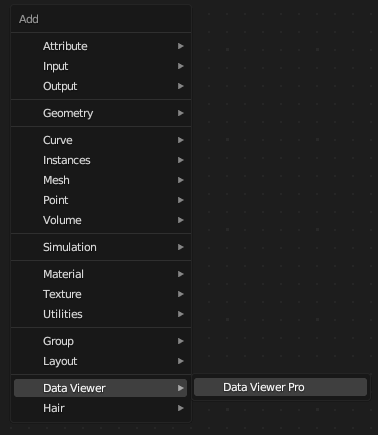
After installation, you can add Data Viewer node from the Add menu by pressing Shift + A in the geometry node editor, or drag the Data Viewer from the Asset Browser to the Geometry Node Editor.
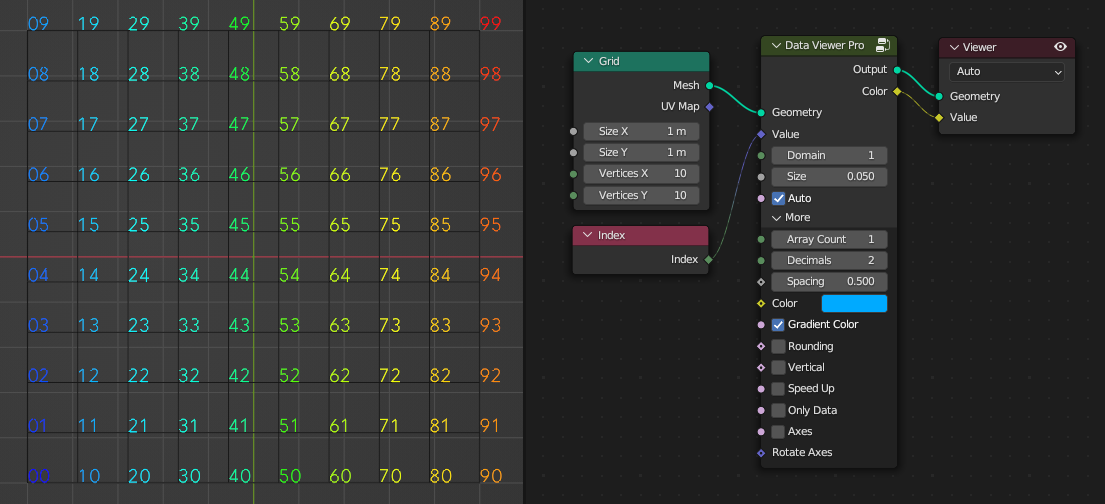
If you want to preview the index of a grid, you can connect the nodes as follows.
The domain value is used to modify the domain to be viewed. The range is -2 to 5. A value of 0 is automatic mode, details are shown in the table below.
| Spline | Instance | Auto | Point | Edge | Face | Face Corner | Face & Corner |
|---|---|---|---|---|---|---|---|
| -2 | -1 | 0 | 1 | 2 | 3 | 4 | 5 |
If you want to check the position information of the vertex, just replace the ID node with the position.
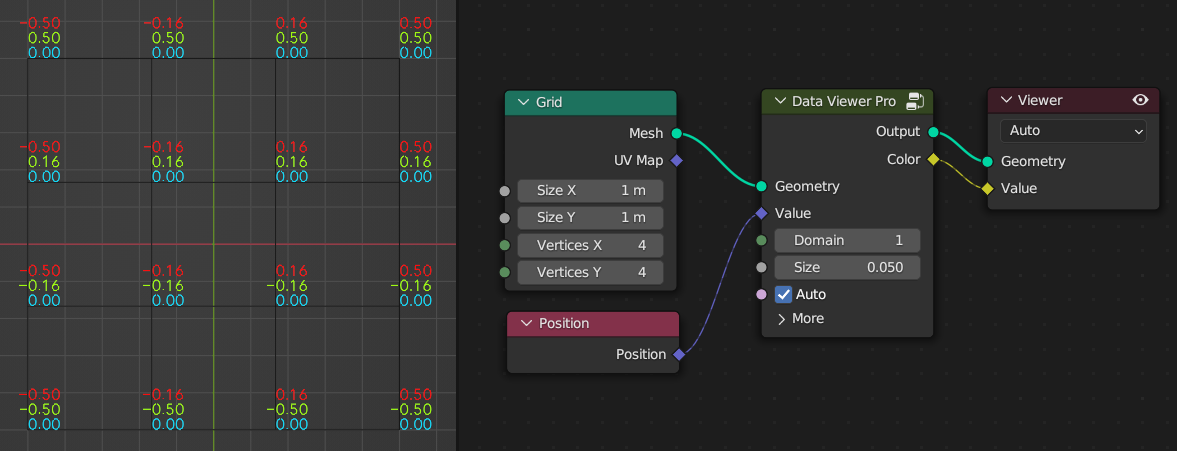
In addition, you can also modify the size of the numbers. For more options, you can also set vertical display, gradient color or axial arrows, etc.
The speed up option allows you to preview the large data more smoothly.
Use gradient color to mark the size of values. Blue represents the minimum, red represents the maximum.
You can also use axes instead of numbers. r, g, b corresponds to x, y, z respectively, and the darker colors are negative values.
By the way, Rotate option allows you do some rotation tests, which will be useful when you are confused :P
View point cloud data.
For more information, please see the following chapters.
Get more blender addons or tutorials:
- https://blendermarket.com/creators/cgpiece
- https://cgpiece.gumroad.com
- https://www.youtube.com/@cgpiece
The font used is Relief-SingleLine, designed by Élisa Garzelli & Noëlie Dayma. Many thanks to them!
🐔Comparison
Data Viewer is available in three versions: Lite, Standard, and Professional. The lite version only supports a single array, the standard supports 3d arrays, such as position, rotation, etc. The Pro version adds some automatic processing, previews with axial arrows, and folding panel. Details are shown in the table below.
| Features | Lite | Std | Pro |
|---|---|---|---|
| Interface | 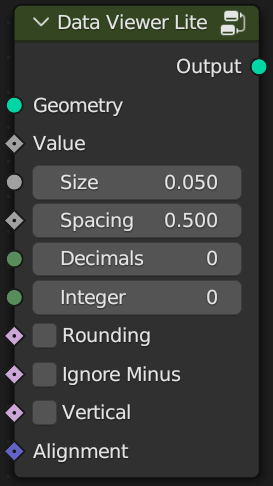 | 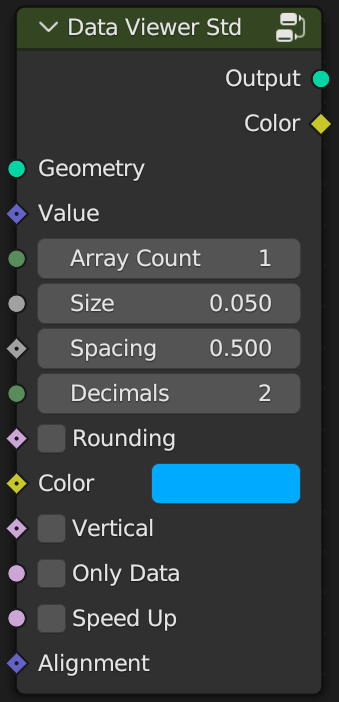 | 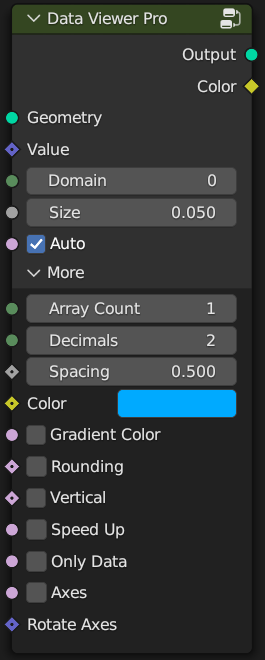 |
| 3D Array | 😭 | 😁 | 😃 |
| Number Size | 😁 | 😁 | 😁 |
| Number Spacing | 😁 | 😁 | 😁 |
| Decimals | 😁 | 😁 | 😃 |
| Rounding | 😁 | 😁 | 😁 |
| Integer | 😃 | 😃 | 😃 |
| Ignore minus | 😁 | 😃 | 😃 |
| Alignment | 😁 | 😁 | 😃 |
| Vertical | 😁 | 😁 | 😁 |
| Only Data | 😭 | 😁 | 😁 |
| Speed Up | 😭 | 😁 | 😁 |
| Color | 😭 | 😁 | 😁 |
| Gradient Color | 😭 | 😭 | 😁 |
| Domain | 😭 | 😭 | 😁 |
| Axes | 😭 | 😭 | 😁 |
| Rotate Axes | 😭 | 😭 | 😁 |
| Folding UI | 😭 | 😭 | 😁 |
| Auto Mode | 😭 | 😭 | 😁 |
😃 This is automatic, and some don't provide option settings.
Data Viewer Lite
Geometry: Connect the geometry object you want to view
Value: Connect the attribute to be viewed. The Lite version does not support 3D array.
Size: Set the size of the text.
Spacing: Set text spacing.
Decimals: Set the decimal length.
Integer: Set the integer length, automatically when the value is 0.
Rounding: Set decimal rounding.
Ignore Minus: Whether the minus sign should be considered in the alignment operation.
Vertical: vertical display.
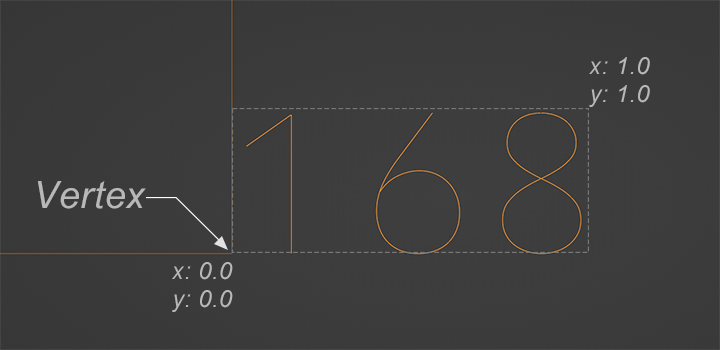
Alignment: Align text to vertices. Range 0-1. When the value is (0 , 0), it will be aligned to the lower left corner of the text. When the value is (1, 1), it will be aligned to the upper right corner, 0.5 will center align. As shown below:
Data Viewer Std
Geometry: Connect the geometry object you want to view.
Value: Connect the attribute to be viewed.
Array Count: Set the length of the array, ranging from 1-3. When the input is an integer or float, the value should be 1. When the input is a vector, such as a position attribute, the value should be 3.
Size: Set the size of the text.
Spacing: Set text spacing.
Decimals: Set the decimal length.
Rounding: Set decimal rounding.
Color: Set the color. When the array value is greater than 1, the color can be used to modify the saturation and brightness of RGB.
Vertical: vertical display.
Only Data: Only display data.
Speed Up: Whether to enable speed up, which will be very helpful for large amounts of data.
Note: Scene time nodes or key frames will reduce performance.
Alignment: Align text to vertices. Range 0-1. When the value is (0 , 0), it will be aligned to the lower left corner of the text. When the value is (1, 1), it will be aligned to the upper right corner, 0.5 will center align. As shown below:
Data Viewer Pro
Geometry: Connect the geometry object you want to view.
Value: Connect the attribute to be viewed.
Domain: Set the domain to be viewed. The range is -2 to 5. A value of 0 is automatic mode, details are shown in the table below.
| Spline | Instance | Auto | Point | Edge | Face | Face Corner | Face & Corner |
|---|---|---|---|---|---|---|---|
| -2 | -1 | 0 | 1 | 2 | 3 | 4 | 5 |
Size: Set the size of the text.
Auto: Automatically identify whether the input is an integer or a decimal, and the length of the array.
Note: Sometimes it may be note accurate. Just turn off automatic and set it manually.
More Setting:
Array Count: Set the length of the array, ranging from 1-3. When the input is an integer or float, the value should be 1. When the input is a vector, such as a position attribute, the value should be 3.
Decimals: Set the decimal length.
Spacing: Set text spacing.
Color: Set the color. When the array value is greater than 1, the color can be used to modify the saturation and brightness of RGB.
Gradient Color: Use color to mark the size of values. Blue represents the minimum, red represents the maximum.
Rounding: Set decimal rounding.
Vertical: vertical display.
Speed Up: Whether to enable speed up, which will be very helpful for large amounts of data.
Note: Scene time nodes or key frames will reduce performance.
Only Data: Only display data.
Axes: Use axes instead of numbers. r, g, b corresponds to x, y, z respectively, and the darker colors are negative values.
Rotate Axes: It can help you do some rotation tests, which will be useful when you are confused :P
Note: Alignment options are not available in the pro version. Because it's all automatic. Edge, face and corner are aligned to the center, and everything else is aligned to the lower left corner. By the way, the point cloud will be automatically left aligned based on the radius, as shown in the figure below.